

This post is written by Michele Pratusevich. I love the Python programming language, and I love computational photography. This post describes how to make (almost) any Instagram filter with about 15 lines of Python, using the (now-defunct) Gotham Instagram filter as a case study. I presented this at a lighting talk at the Boston Python Meetup on December 20th, and you can find my slides on my personal site.
First we will go through some basic setup and dependencies, then we’ll build the elements of an Instagram filter, and finally at the end we will build the filter itself.
There are a number of libraries that let you do image processing in Python, but the ones I use in this post are: matplotlib for plotting images, numpy for processing lits of floats, and scikit-image for loading the image. The code I show here is meant for a Python script, bit you can extend the code into a jupyter notebook to make it interactive. That will be the subject of a subsequent post.
Let’s set up our dependencies:
import matplotlib.pyplot as plt
import skimage
from skimage import io
from skimage import filters
import numpy as np
I also personally like to (when viewing images), set the default axes in matplotlib to not show any labels or tick marks on the x and y axes:
import matplotlib
matplotlib.rcParams['xtick.major.size'] = 0
matplotlib.rcParams['ytick.major.size'] = 0
matplotlib.rcParams['xtick.labelsize'] = 0
matplotlib.rcParams['ytick.labelsize'] = 0
All the images I generated in this post were made with matplotlib using these settings.
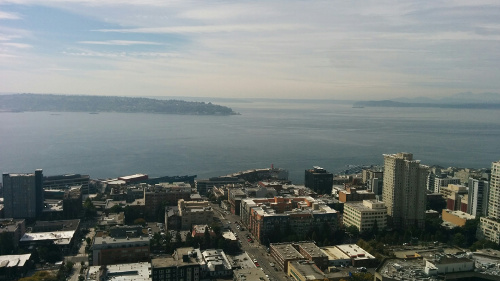
Let’s import a picture (I am using a picture I took in downtown Seattle that is hosted here that you are welcome to use as well). We will import it using scikit-image, but we still have to be careful. Most images are formatted in uint8, which means that every pixel color is an integer from 0 to 255. For example, red is (255, 0, 0) and blue is (0, 0, 255). When you are doing arithmetic on images (like dividing all pixels by some value), you want your pixels to be represented as decimal numbers or floats. So when we import our image, we will both read the image and automatically convert it to storing pixel values as floats in the range of (0, 1).
For this code to work, make sure the skyline.jpg image is in the same folder as your Python script. If it is not in the same folder, just put the full or relative path of the file into the imread function.
original_image = skimage.img_as_float(io.imread("skyline.jpg"))If you want to see the image, you can use matplotlib:
plt.imshow(original_image)
plt.show()
You should see this image. It’s the one we will be working with for the rest of this post.
There are two basic ingredients to any Instagram filter:
We will go through both image manipulations and ultimately put together the Gotham filter using these two elements.
The first element to any Instagram filter is sharpening or blurring an image.
Sharpening an image is the same as removing a blurred version of the image from itself. This is exactly how we will implement sharpening an image. First, blur an image using a Gaussian blur, then subtract a portion of the Gaussian blur from the original image. Presto, a sharper image!
def sharpen(image, a, b, sigma=10):
    blurred = filters.gaussian(image, sigma=sigma, multichannel=True)
    sharper = np.clip(image * a - blurred * b, 0, 1.0)
    return sharper
Our sharpen function takes 4 arguments: the image, two constants, a being the amount to multiply the original image by, and b being the amount to multiply the blurred image by, and an optional sigma value for our Gaussian. Higher values of sigma will cause more radical blurring. scikit-image implements a Gaussian filter for us, so no need to remember those pesky formulas. Also, we need to make sure to clip our image to the range 0 to 1.0, so we don’t have any strange artifacts - this is what the np.clip portion of the code above does. So, to sharpen our original image, we just do the following:
sharper = sharpen(original_image, 1.3, 0.3)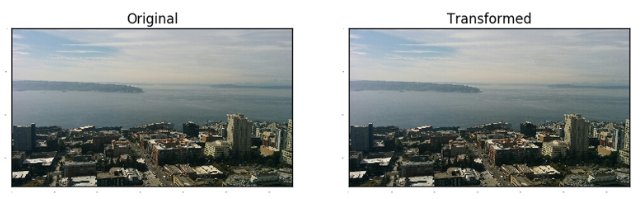
We can use the sharpen function above to also blur the image. What happens is that we are already computing a blurred image in the function to subtract from the original image. So to blur the image, all we have to do is call sharpen with a = 0 and a negative value of b:
blurred = sharpen(original_image, 0, -1.0)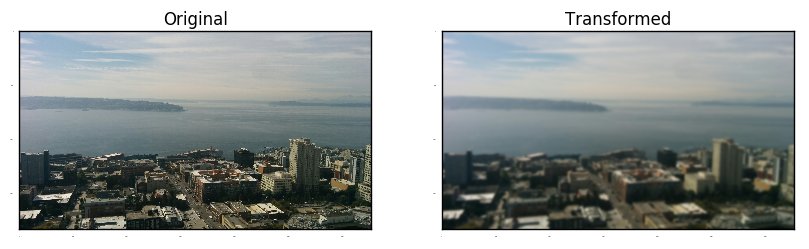
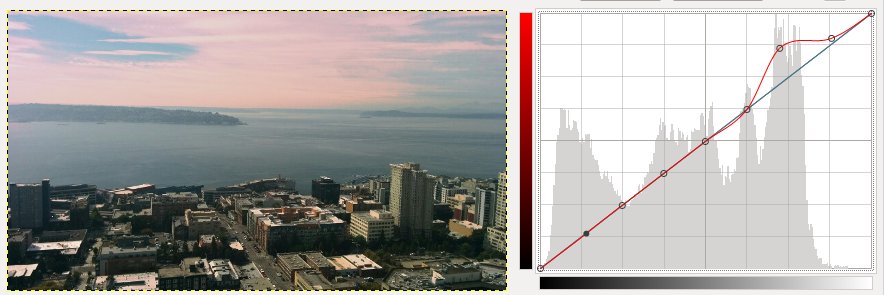
The second element to any Instagram filter is the ability to adjust any image channel by linear interpolation. If you have ever used Adobe Lightroom, Photoshop, or Gimp, you will have seen the histogram of color values:
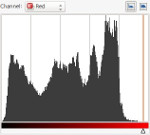
What we want to be able to do is manipulate the an individual color channel by stretching or squeezing particular color ranges. As we mentioned before, there are 255 different values a single pixel can take - all the red pixels have a value between 0 and 255. Same for the green and blue channels. What we want to do is be able to say something like “let’s take all the strong blues and make them even bluer, but in a way that looks natural.” The way we can do this in practice is to linearly interpolate a range of values in the histogram above to a different range. That way, the color changes will look “natural”, but they will be modified.
For example, Gimp does this in a more sophisticated way by using spline interpolation:
To make our code simpler, we will just use linear interpolation between various points on the curve. This way, we can specify the interpolation we want with a series of values. The one thing to keep in mind is that we are manipulating images in the float range from 0.0 to 1.0, but when our image gets displayed or written to a file, they will be bucketed in the range 0 to 255. Our code looks like this:
def channel_adjust(channel, values):
# flatten
orig_size = channel.shape
flat_channel = channel.flatten()
adjusted = np.interp(
flat_channel,
np.linspace(0, 1, len(values)),
values)
# put back into image form
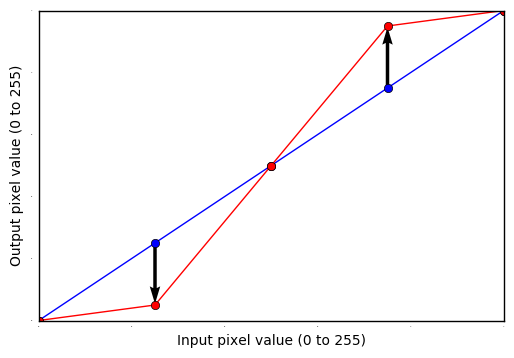
return adjusted.reshape(orig_size)We will take in a single image channel (either the red, blue, or green channel), and specify a list of float values that will serve as our interpolation points. The channel will then be broken into that many segments, and the points originally from those segments will be linearly interpolated according to the values. For example, if I specify the values as [0, 0.05, 0.5, 0.95, 1.0], the values from [0, 1.0] will be broken into 5 equal buckets: [0, 0.25, 0.5, 0.75, 1.0], and each segment of values will be mapped to the output values. So the range [0, 0.25] will be re-mapped linearly to the range [0, 0.05]. The range [0.25, 0.5] will be mapped to the range [0.05, 0.5], and so on.
A visualization of what the code is doing is shown below:
What this does to a real image channel (say the red channel, to mimic the output of Figure 5 above) looks like this, using the values [0, 0.125, 0.25, 0.375, 0.5, 0.625, 0.865, 0.875, 1]:
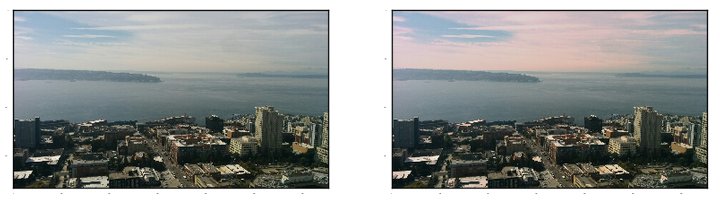
So what we have is a way to manipulate individual image channels to modify the color composition of any image.
To finish off our Instagram filters, we just need two helper functions:
To split an image into red, green, and blue channels, just take the first, second, and third elements of the image respectively. We are lucky that scikit-image reads images in the standard “RGB” image format, where the first channel is red, the second green, and the third blue.
def split_image_into_channels(image):
    red_channel = image[:, :, 0]
    green_channel = image[:, :, 1]
    blue_channel = image[:, :, 2]
    return red_channel, green_channel, blue_channel
And now to merge the channels back into an image:
def merge_channels(red_channel, green_channel, blue_channel):
    return np.stack([red_channel, green_channel, blue_channel], axis=2)
To prove to yourself that this works, you can split, merge, and show the image:
r, g, b = split_image_into_channels(original_image)
im = merge_channels(r, g, b)
plt.imshow(im)
plt.show()
And you should see the original image in Figure 1 back again.
Now let’s put it all together to make the Gotham filter. The Gotham filter is calculated as follows:
And we’re off!
First, split the image into channels for manipulation.
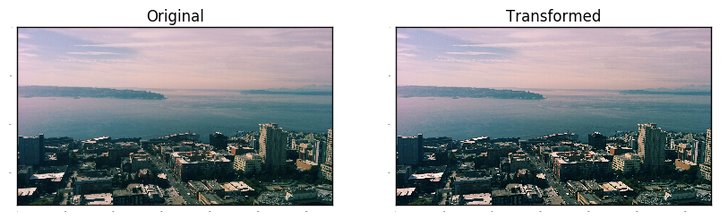
r, g, b = split_image_into_channels(original_image)Next, we will increase the contrast in the reddish mid-tones by stretching out the red channel.
r_boost_lower = channel_adjust(r, [
0, 0.05, 0.1, 0.2, 0.3,
0.5, 0.7, 0.8, 0.9,
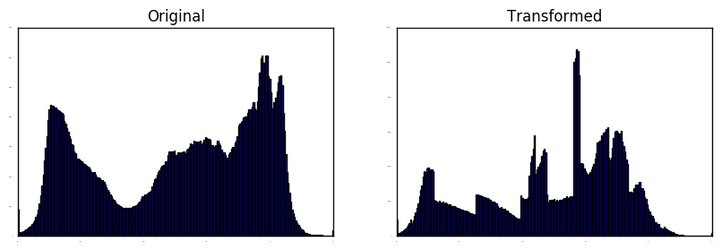
0.95, 1.0])You can see the histogram changes:
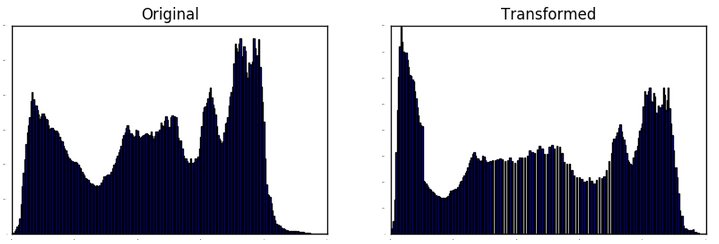
And the image changes:

Next, we’ll make the blacks a little bit bluer, by simply adding 0.03 to every single black pixel value. This makes everything that is already blue, bluer. We’ll merge the image back together to see where we are at now. We use np.clip to make sure none of the image pixel values end up outside the allowed image range, so in some cases we are saturating the blue channel.
bluer_blacks = merge_channels(r_boost_lower, g, np.clip(b + 0.03, 0, 1.0))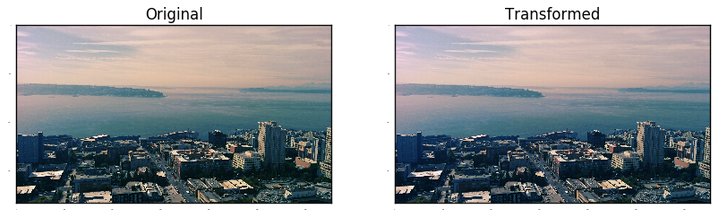
Now let’s sharpen, using the sharpening function we discussed above.
sharper = sharpen(bluer_blacks, 1.3, 0.3, sigma=10)You can see more detail, especially around the edges of the buildings.
Lastly, there are two manipulations on the blue channel we will accomplish with one call to our linear interpolation function. We will increase the blue channel in the lower mid-tones and decrease the blue channel in the upper mid-tones. Thankfully all this requires is clever choosing of the linear interpolation coefficients. Because we’ve changed the image channels by sharpening the image in the previous step, we need to re-split the image into red, green, and blue channels.
r, g, b = split_image_into_channels(sharper)
b_adjusted = channel_adjust(b, [
    0, 0.047, 0.118, 0.251, 0.318,
    0.392, 0.42, 0.439, 0.475,
    0.561, 0.58, 0.627, 0.671,
    0.733, 0.847, 0.925, 1])
And you can see the histogram of the blue channel as it is transformed:
All in all, you can make the Gotham Instagram filter with just 15 lines of Python (not including imports):
import numpy as np
import skimage
from skimage import io, filters
def channel_adjust(channel, values):
    orig_size = channel.shape
    flat_channel = channel.flatten()
    adjusted = np.interp(flat_channel, np.linspace(0, 1, len(values)), values)
    return adjusted.reshape(orig_size)
original_image = skimage.img_as_float(io.imread("skyline.jpg"))
r = original_image[:, :, 0]
b = original_image[:, :, 2]
r_boost_lower = channel_adjust(r, [
    0, 0.05, 0.1, 0.2, 0.3,
    0.5, 0.7, 0.8, 0.9,
    0.95, 1.0])
b_more = np.clip(b + 0.03, 0, 1.0)
merged = np.stack([r_boost_lower, original_image[:, :, 1], b_more], axis=2)
blurred = filters.gaussian(merged, sigma=10, multichannel=True)
final = np.clip(merged * 1.3 - blurred * 0.3, 0, 1.0)
b = final[:, :, 2]
b_adjusted = channel_adjust(b, [
    0, 0.047, 0.118, 0.251, 0.318,
    0.392, 0.42, 0.439, 0.475,
    0.561, 0.58, 0.627, 0.671,
    0.733, 0.847, 0.925, 1])
final[:, :, 2] = b_adjusted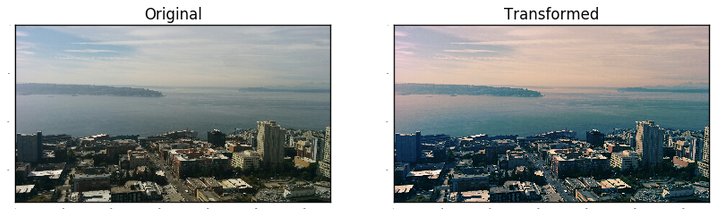
Play around, create your own filters!
I took inspiration (and a few linear interpolation values) from Michael Mullany’s post at Creative Bloq on how to re-create the Gotham Instagram filter using SVG components. Because I chose to do my filters in Python, I did not use exactly the same techniques as shown in the article.